One of our clients had a web application with an admin area where every table had its own page. Organizations, users, reports and many more, somewhere between 60 and 70 of them. An admin could open any table, scroll through its records, search or filter by one of its columns, and open a single record to see the details.
For a question about one table, that was enough. Then came questions like this one:
“How many organizations do we have, how many are active, and how many created a report in the last 30 days?”
That question needs two tables at once, organizations and reports. Each list page only knew about its own table and its own columns. To get the answer, an admin had to export both lists and match them up in a spreadsheet, or ask someone who could write a query and wait.
We had been building screens for this application for a long time, so we knew the gap well. More filters would never close it, because the next question would always need a different combination of tables. So we built a place to ask the question itself.
What we set out to build
An admin types a question the way they would ask a colleague. The assistant works out which tables hold the answer, fetches the data and shows the result as the right piece of screen. A list of records comes back as a table. A comparison comes back as a chart. A count comes back as a number.
We set two rules on day one. The assistant only reads data and never changes anything. And it goes through the same data service the application already used, so there is no second copy of the data to keep in sync.
Our first version made things up
We started with a pipeline: four AI calls in a row. The first picked the tables. The second rewrote the question more precisely. The third built the query. The fourth wrote the answer.
Easy questions worked. Harder ones fell apart in a very specific way. The model invented field names. Ask who created a report and it would look for a field called creator. Or author. Or createdDate. None of them existed.
So we did what most teams do first. We wrote stricter instructions. We gave the model a numbered list of allowed fields under a heading in capital letters. We added a second model to check the first one's plan, and switched it off soon after. We had the model pick fields by number and turned the numbers back into names in code.
Each fix was one more rule for the model to remember. We were patching its guesses one at a time.
What worked: tools that talk back
Two days in, we changed course. In place of the pipeline we put a single AI agent with a small set of tools, and let it decide which ones to use and in what order. It can:
- look up which tables and fields match the question
- fetch records
- count records in groups
- count records over time, by day, week or month
The change that mattered most was inside the tools. Field names the agent sends are checked against the fields that exist. When one is wrong, the tool doesn't fail quietly. It replies the way a teammate would: there's no field called author here, did you mean createdBy? The agent reads that, fixes its query and tries again, all inside the same answer.
We used the same idea in other places. When a search comes back empty because someone typed "urgent" and the data says "high", the agent is told to look at the values that exist, match them by meaning and search again. When a name matches two people, it stops and asks which one you meant.
A simple question takes three steps: find the tables, run one query, write the answer. When the agent has to correct itself it takes a few more, up to a limit we set. Once this version had settled, we deleted the old pipeline. It was about 3,000 lines of code.
Teaching it the data
An AI model knows nothing about your database, and table names on their own don't say much. So we wrote it a guide.
Each table in the guide has a short description in plain words, the words people tend to use for it, and how it links to other tables. For more than half of them, the fields have descriptions too. A script pulls the raw structure from the data service, but every description was written by hand.
Some descriptions carry small tips. One says, more or less: when someone asks about reports, count them, don't list them all.
When a question comes in, the agent searches the guide and sees only the handful of tables that match. It never gets the whole structure dumped on it at once.
This guide is the least exciting part of the project. If we did it again, we'd still put most of our care here.
Generative UI, with code choosing the view
Generative UI means the screen is put together from each answer instead of being designed in advance. Vercel's AI SDK can show a component for each tool the AI calls. Vercel's json-render goes a step further: the AI writes a small JSON description of the screen, using only components from a catalog you define, and a renderer draws it.
What we built has the same parts:
- A catalog of components. Totals, a pie or bar chart, a table and a trend chart, each written once in React.
- A description of the screen. With every answer, the server sends a short list of typed blocks, like
stat,breakdownortable, each with the data it needs. - A renderer. The page reads each block's type and draws the matching component.
The only difference is who writes the description. We tried letting the AI do it. One evening we gave the assistant the block types and asked it to describe the screen along with its answer. Its instructions grew past 300 lines. The next morning we took that part out, because the server already knew what kind of answer it had. It looks at the tool the assistant used last:
- fetching records gives a table, with a link to each record
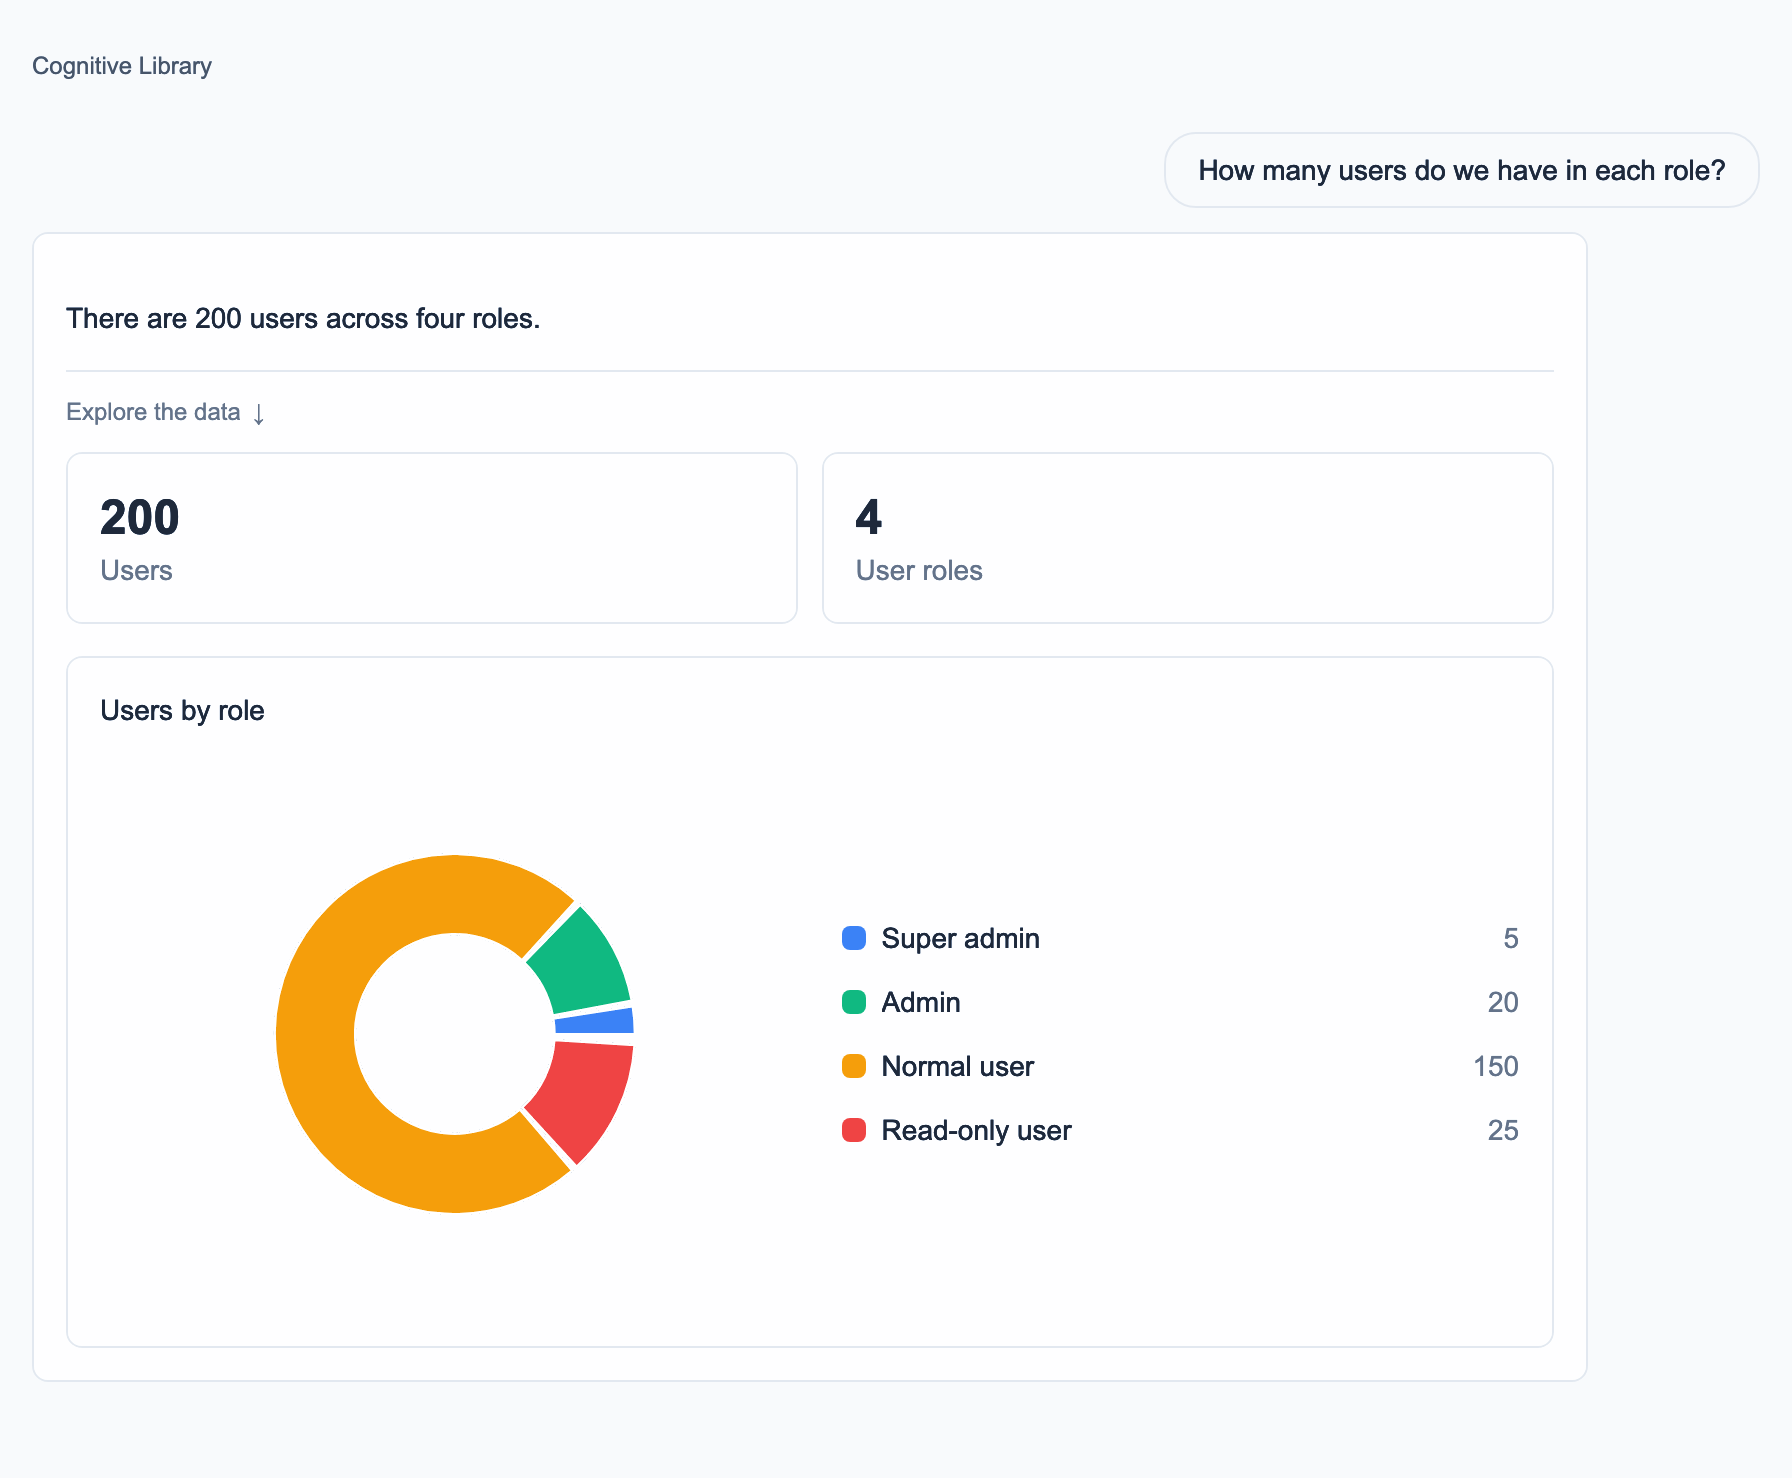
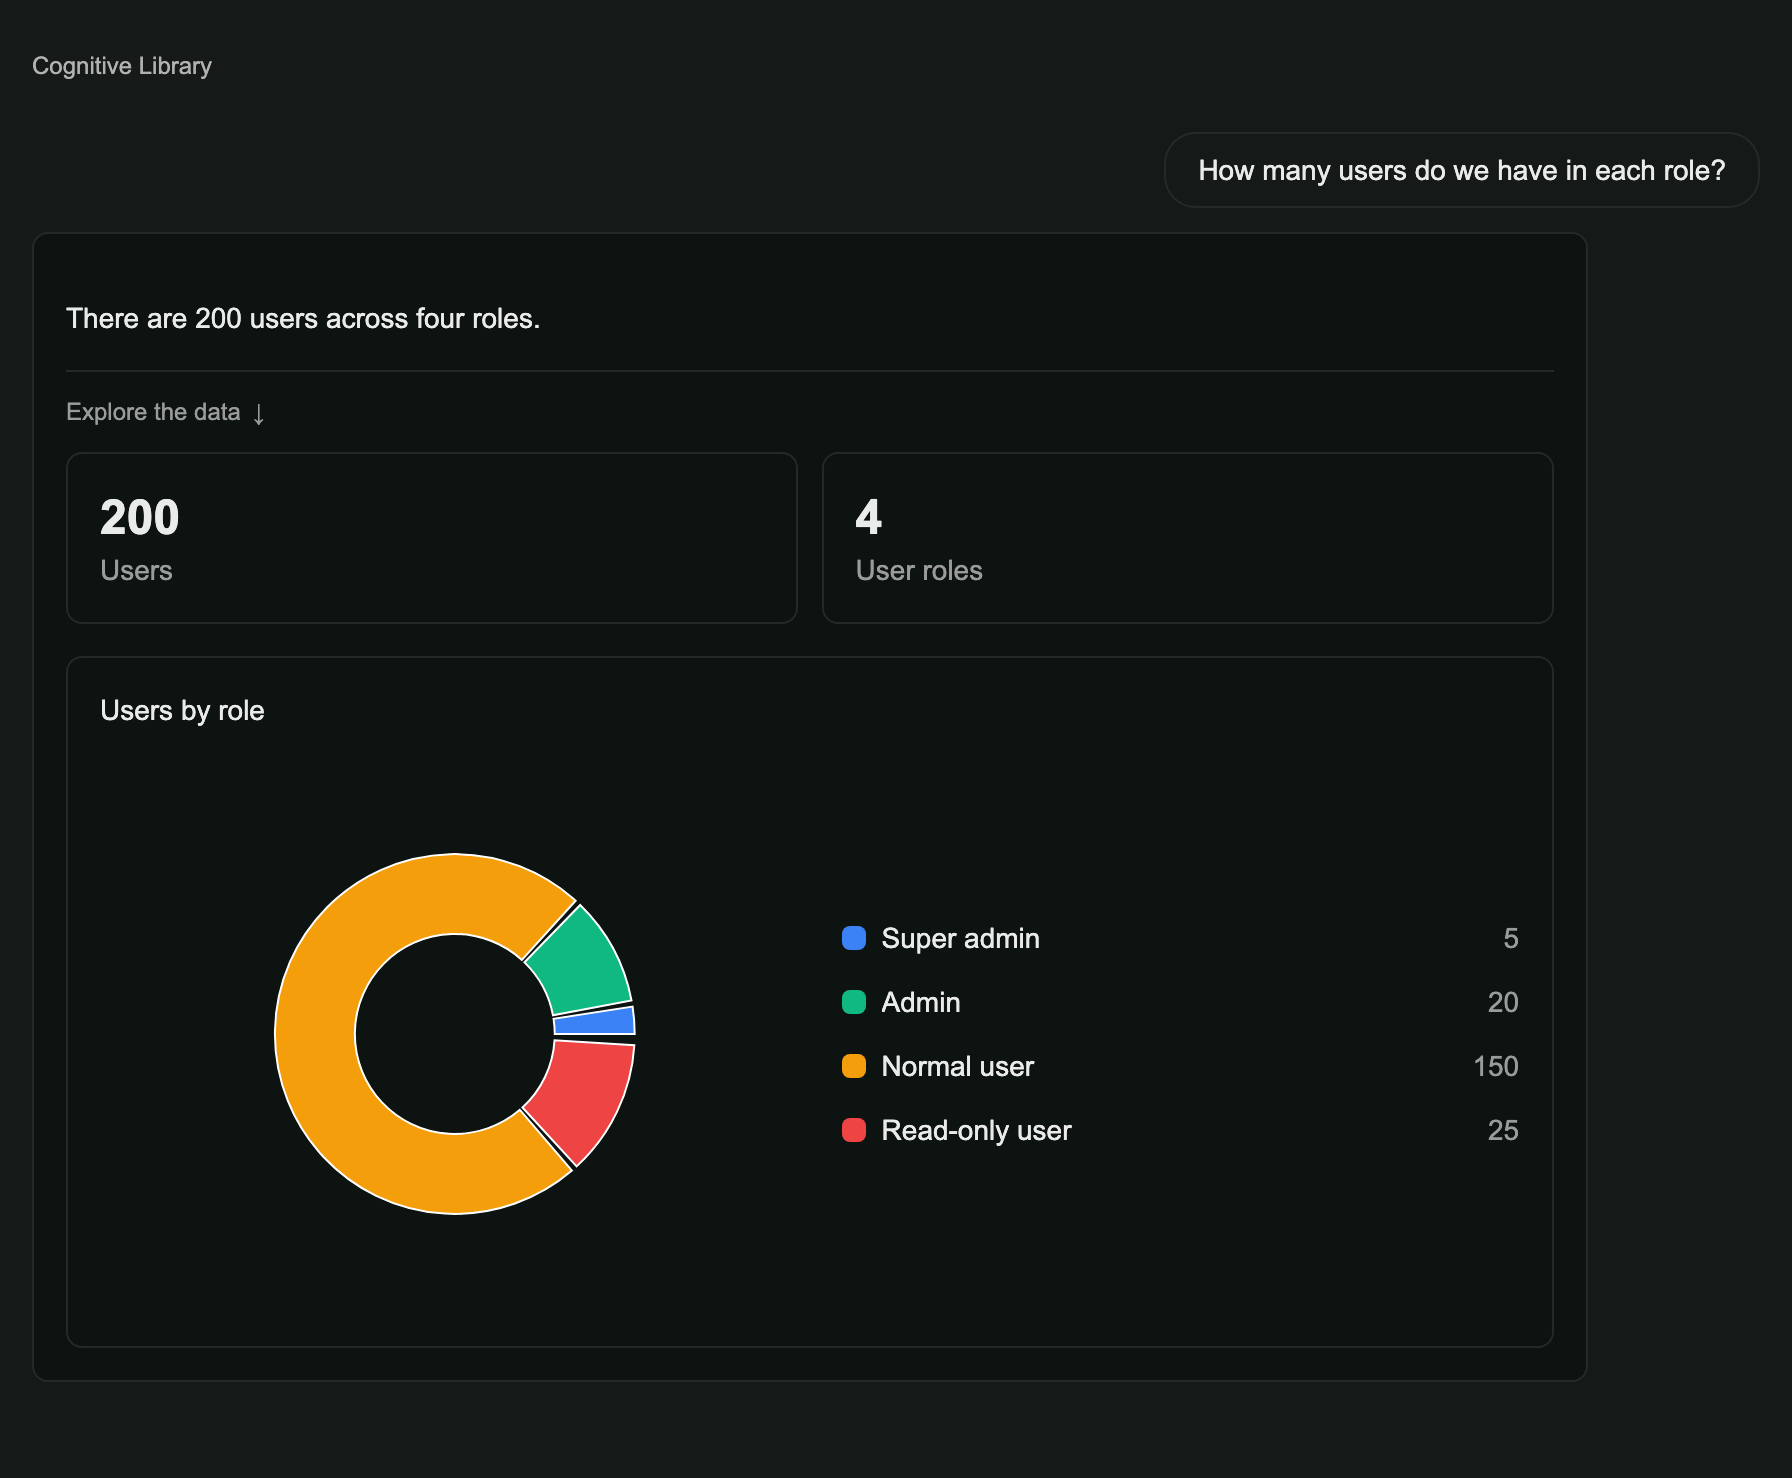
- counting in groups gives totals and a chart, a pie for six groups or fewer and a bar for more
- counting over time gives a trend chart
So the AI still shapes the screen, one step earlier. When it chooses how to ask the data a question, it also chooses what the admin will see. The assistant's instructions got about a hundred lines shorter, and the same data always gets the same view.
If the questions ever need layouts these rules can't predict, moving to a screen written by the AI is a small change. We built the assistant with Mastra, which can stream an agent and its tool results straight into the AI SDK's interface. The same agent and tools would carry over, and so would the catalog and the renderer. Only the author of the description would change.
See it answer
Here are two questions from the project, replayed step by step. Pick one to follow how it gets answered.
1 Question
2 How it answers
60–70 tables3 Result
ChartThere are 200 users across four roles.
The assistant picks the view that fits the answer.
If your application has data your users can't easily ask about, we'd like to hear about it. Tell us about it and one of our engineers will get back to you. You can also read the Cognitive AI case study or see our AI development work.