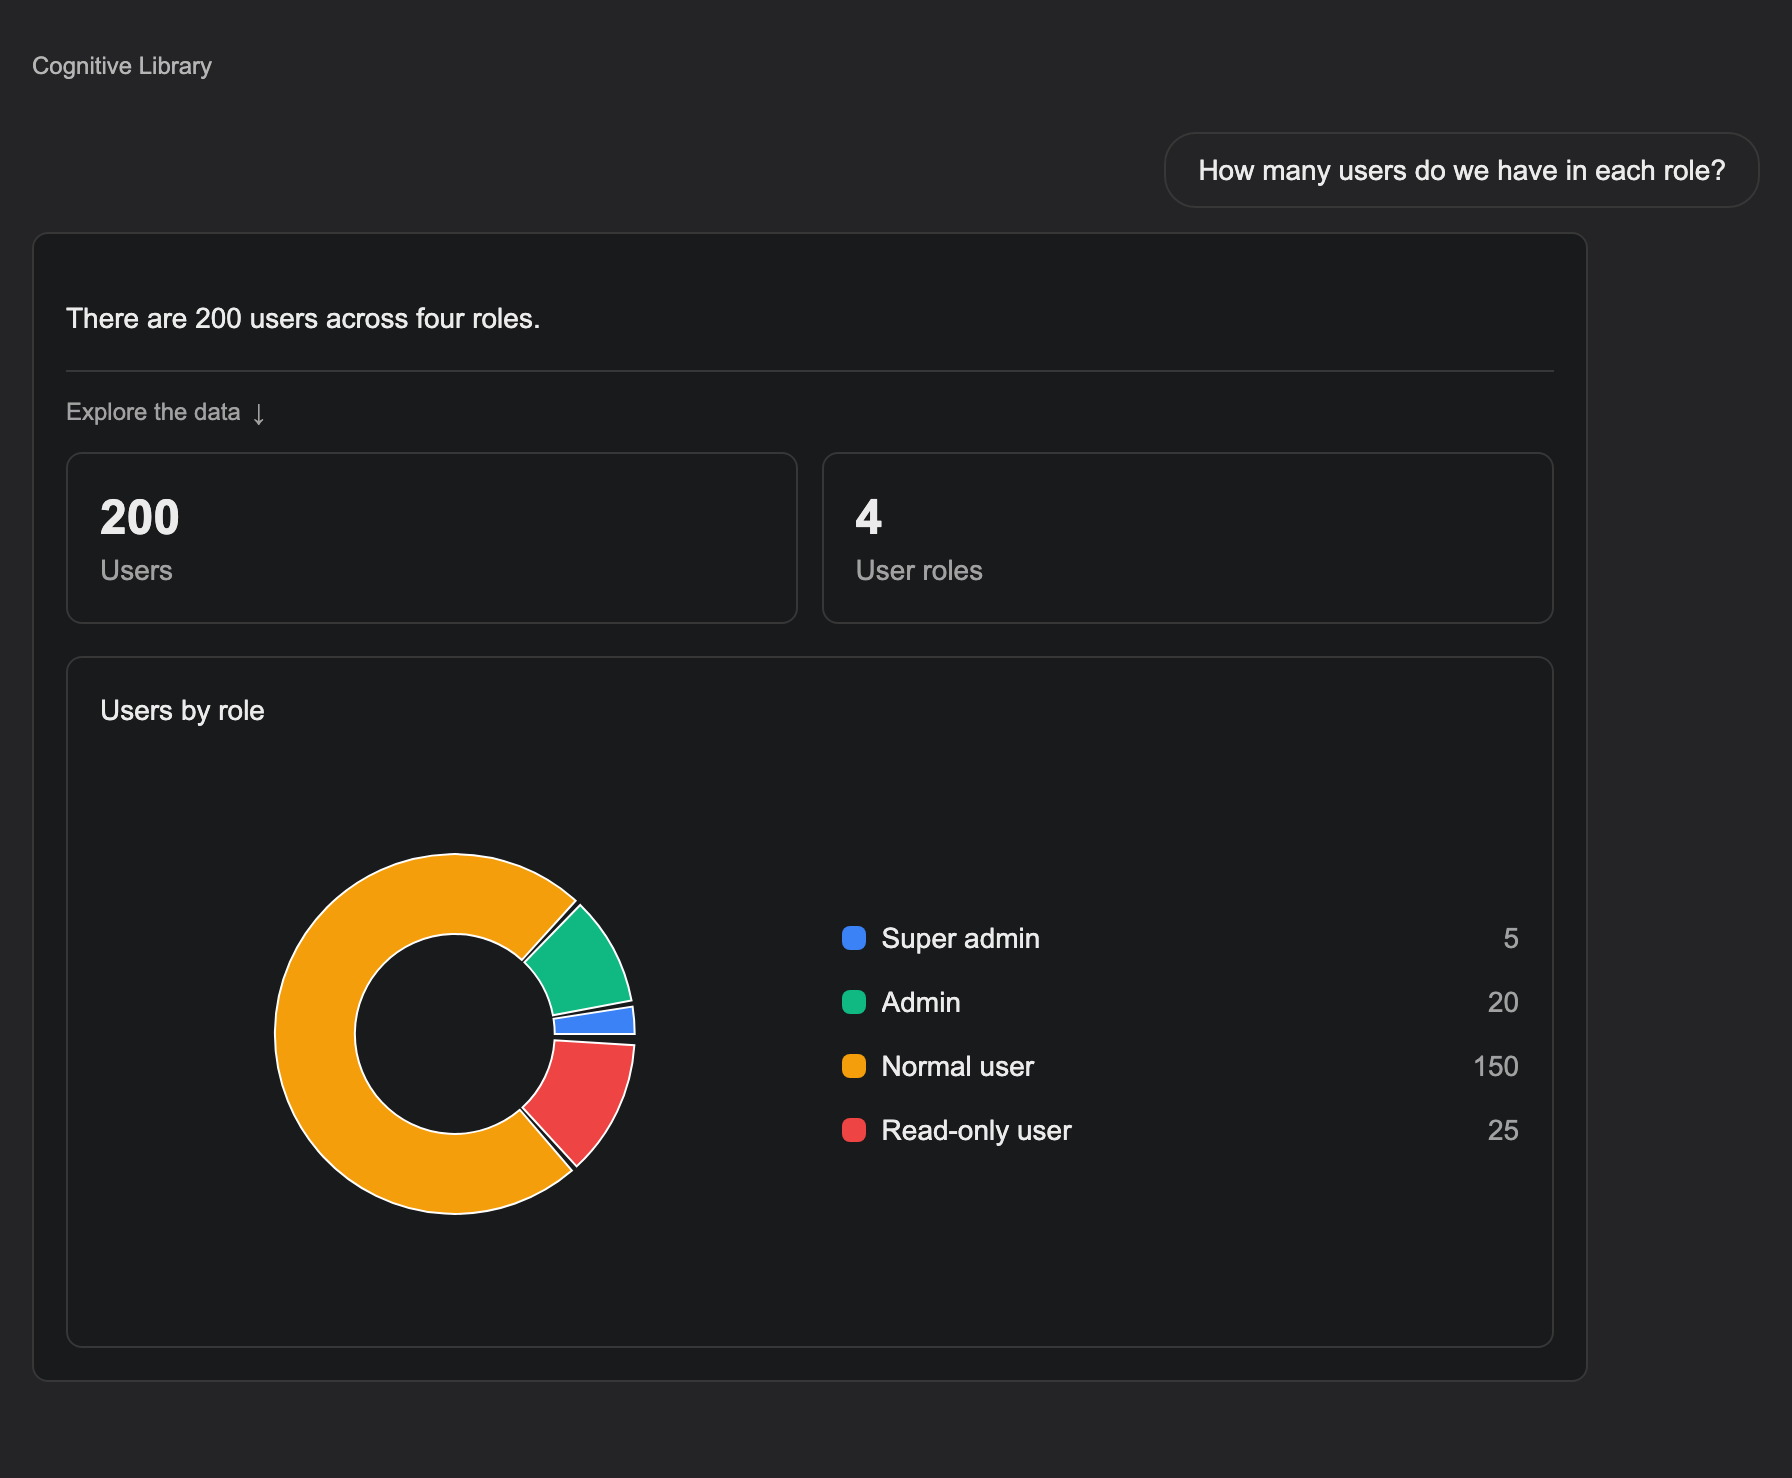
Count users by role
“How many users do we have in each role?”
Find where user roles are stored, group users by role and count each group. The result becomes a chart showing super admins, admins, normal users and read-only users.
The application had around 60–70 connected tables for different parts of the platform, including users, organizations and reports. People could browse records and use basic filters, but they could not combine several conditions, count results or group them through the interface. The data was available; getting an answer meant writing a more complex query.
Let people ask a question in their own words. Give the AI descriptions of the tables, columns and connections so it can work out where to look and which queries to run.
We built an AI assistant connected to the application’s existing data service. It turns questions into queries, retrieves matching records and automatically generates a result view based on the response. People can explore the data without writing queries themselves.
Each question needs a different kind of answer. We built the AI assistant to automatically select and generate the interface from the query response. A list of records becomes a table. A comparison becomes a chart. A simple count becomes a total.
The aim is to make the answer easy to understand, without asking people to work through a screen full of raw data.
| What the question needs | How the answer appears |
|---|---|
| Find matching records | A table with the relevant columns |
| Compare groups, such as user roles | A bar or pie chart showing the breakdown |
| See how activity changes over time | A chart showing the trend |
| Get a count or a few key numbers | Clear totals with short labels |
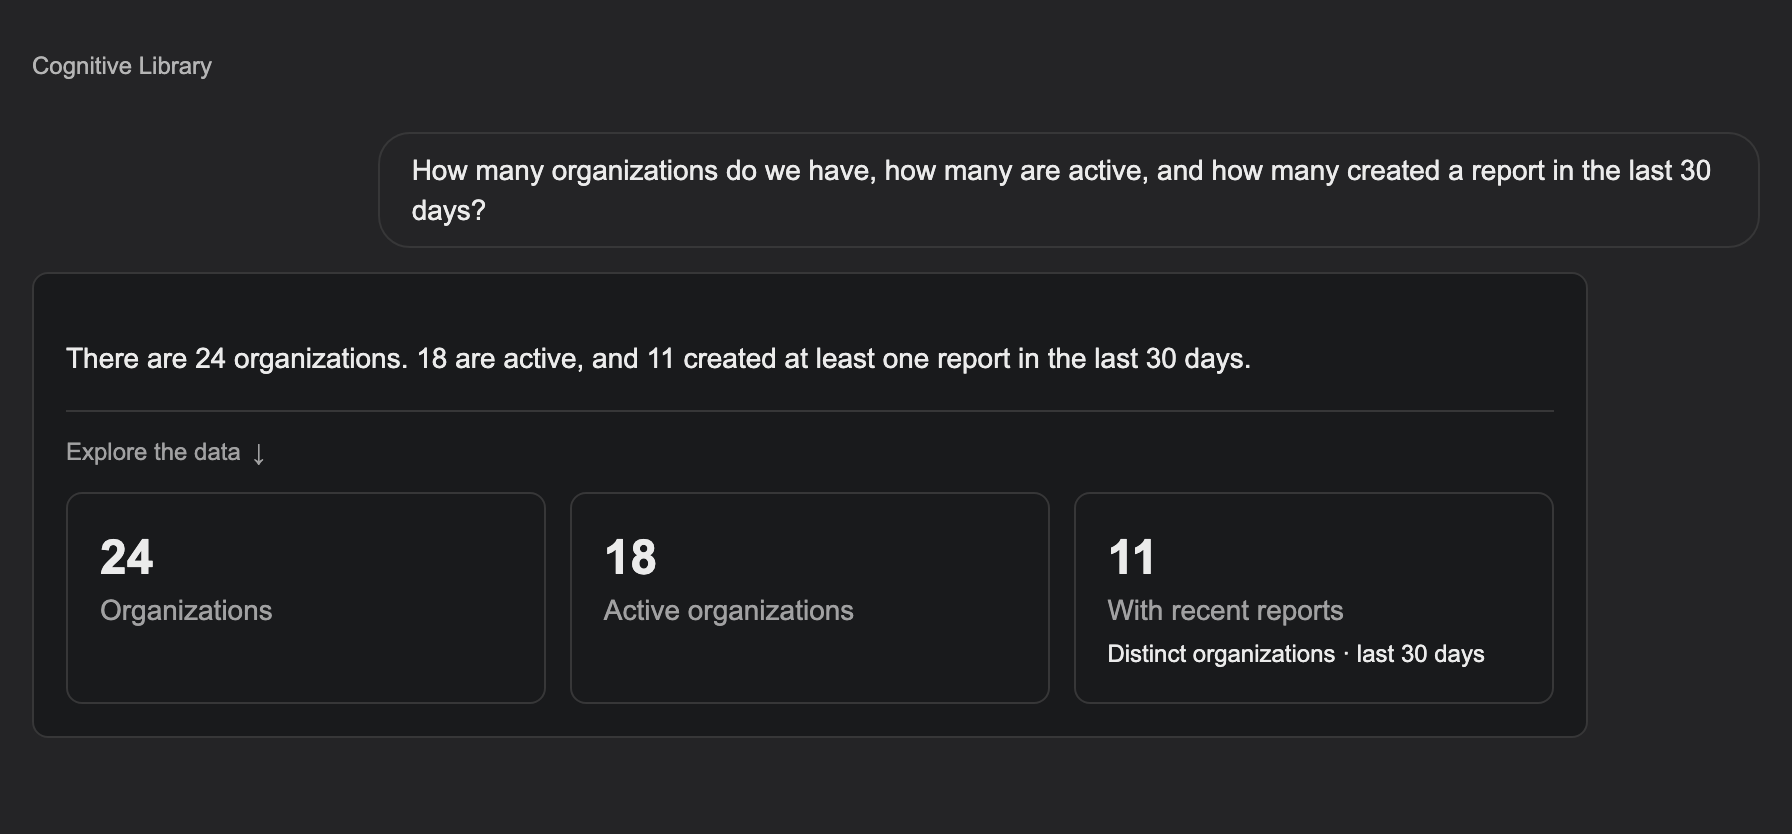
The assistant can generate several views within the same answer. The organization question below, for example, brings together total organizations, active organizations and recent reporting activity.
Work out which records, conditions and time range the person is asking about, and whether they need a list, a count or a comparison.
Read descriptions of the available tables and columns, and how they connect. Identify which data can answer the question.
Choose the columns and filters, and decide what to count or group together. Check that the requested columns exist before running the queries.
Run the queries through the application’s existing data service. Use the returned records and counts to answer each part of the question.
The AI assistant uses the query response to select and generate the right view: a table for records, a chart for comparisons or trends, or totals for counts.
“How many users do we have in each role?”
Find where user roles are stored, group users by role and count each group. The result becomes a chart showing super admins, admins, normal users and read-only users.
“How many organizations do we have, how many are active, and how many created a report in the last 30 days?”
Count organizations, check which are active, then look up their reports from the last 30 days. An organization with several reports is counted once. This example has 24 organizations, 18 active and 11 with recent reports.